Web development
Why a Slow Website Destroys Your Business

Observation
Website speed has a direct impact on business performance.
Web performance is not only a developer concern. It influences how visitors perceive your brand, read your content, interact with your pages and decide whether or not to continue their journey.
A slow website creates immediate friction. It gives an impression of instability, increases the effort required from the user and reduces the chances that they will read, click, complete a form or finalise an action.
Slowness therefore affects several levels at once: user experience, organic visibility, credibility, conversion and profitability. This is why speed should no longer be treated as a technical detail, but as a strategic lever.
A fast website does not only save time. It reduces friction and increases the chances of turning a visit into a result.
Approach
Treating performance as part of the customer experience.
At Edikka, website speed is analysed as a global issue. It is not only about compressing a few images or achieving a better score in a testing tool. The real goal is to understand how performance affects the user’s actual journey.
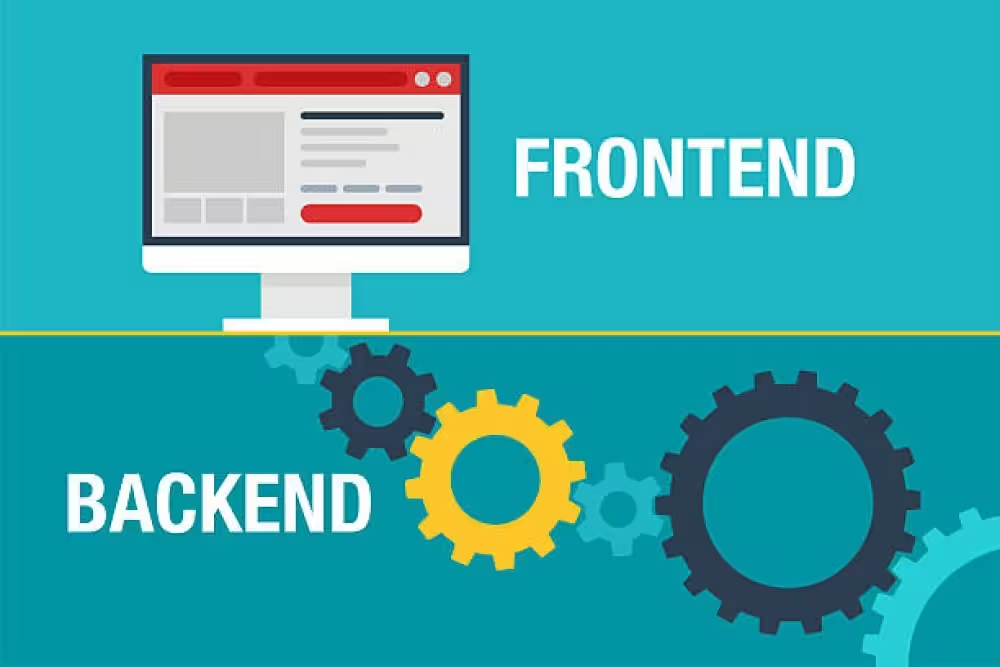
Effective optimisation connects front-end, back-end, hosting, images, scripts, fonts, mobile, SEO and conversion. The objective is simple: make the website faster, smoother, more stable and more profitable.
Speed
02Fluidity
03Trust
04Conversion
Challenge
Why a slow website weakens your entire digital ecosystem.
Slowness does not only delay page display. It influences user behaviour from the very first seconds. The longer a website takes to respond, the more visitors doubt, grow impatient or leave the journey before even evaluating your offer.
This friction then affects overall digital performance: lower engagement, fewer pages viewed, fewer forms completed, fewer sales, less trust and sometimes a more difficult path to maintaining organic visibility.
Abandonment
Visitors leave slow pages more easily, especially on mobile or when they need an answer quickly.
Friction
Every extra delay makes the journey feel more difficult and reduces the desire to continue.
Doubt
A slow website can create an impression of carelessness, fragility or lack of professionalism.
Loss
Slowdowns can reduce leads, sales, quote requests and contact enquiries.
Analysis
The 7 ways a slow website impacts your business.
Website slowness rarely affects only one metric. It influences experience, conversion, SEO, credibility, journey quality and the profitability of marketing actions at the same time.
Understanding these impacts helps prioritise technical optimisations that create real business value, instead of treating performance as a secondary issue.
Users
An immediate loss of attention and engagement
Users expect a fast, smooth and stable experience. When a page takes too long to load, attention drops before the main content has even been viewed.
Slowness creates a break in the journey. It forces users to wait, check whether the website is working, or even go back and choose another option.
The visitor leaves the page before viewing the offer or content.
Waiting creates a sense of effort and lowers perceived quality.
Time on page, clicks and browsing depth can decrease.
An unstable or slow website can make the brand appear less professional.
Conversion
A lower conversion rate at every stage of the journey
Conversion depends on the fluidity of the journey. If a page creates waiting time, if a button responds slowly or if a form takes too long to appear, users may interrupt their action.
SEO
Organic visibility becomes harder to maintain
Performance is part of the overall quality of a page. A slow website can reduce the quality of the user experience and make it harder to sustain long-term organic visibility.
SEO does not depend on speed alone, but a slow, unstable or difficult-to-use page can weaken the effectiveness of content, limit engagement and reduce the real value of the traffic acquired.
Performance does not replace content quality, but it shapes the quality of the experience around that content.
Brand
Brand perception weakened by waiting time
Speed influences the perception of reliability. A slow website can make a company appear less trustworthy, less modern or less attentive to the quality of the customer experience.
- Credibility weakened from the first few seconds
- Perception of a lack of professionalism
- Doubt about the reliability of the service or company
- Less reassuring experience on mobile
- Lower motivation to continue towards an enquiry or purchase
Causes
Slowness is often caused by several accumulated problems
Website slowness rarely comes from one single element. It is often the result of accumulation: oversized images, unoptimised code, unnecessary scripts, insufficient hosting, lack of caching or overly complex front-end architecture.
Files that are too heavy, unsuitable formats or dimensions larger than needed.
Unnecessary CSS, JavaScript or components that slow down page rendering.
High response time, undersized hosting or poorly optimised requests.
No effective caching for pages, resources or static content.
Optimisation
Improving speed with a global approach
Optimising a slow website means addressing the real causes, not only the symptoms. The best actions are those that lighten the page, speed up rendering, improve the server and reduce blocking resources.
- Optimise, compress and resize images
- Reduce CSS, JavaScript and unnecessary components
- Implement deferred loading for non-critical elements
- Use a CDN when the context justifies it
- Configure effective caching
- Choose hosting adapted to the website’s traffic and needs
Growth
Turning performance into a competitive advantage
A fast website creates an experience that feels smoother, more credible and more reassuring. This quality can become a competitive advantage, especially when users compare several websites, services or providers.
A faster website supports engagement, content consumption, conversion and perceived quality.
Improving speed helps make better use of existing traffic without relying only on new visitors.
A fast and stable experience creates an impression of control, seriousness and professionalism.
Prioritisation
Fixing first the slowdowns that hold back results.
Not all performance optimisations have the same impact. The most important pages should be prioritised: landing pages, strategic SEO pages, service pages, checkout funnels, forms and pages receiving the most qualified traffic.
The right approach is to identify the issues that directly affect initial loading, mobile fluidity, key interactions and steps close to conversion.
Impact, traffic, conversion, effort.
Does the issue slow down display, interaction or stability on important pages?
Does the page receive a significant share of organic, paid or direct traffic?
Does the slowdown affect a step close to a purchase, form or contact request?
Is the correction quick to apply, or does it require deeper technical work?
Early signals
Signs that a slow website is already hurting performance.
Speed problems are not limited to a technical score. They often appear in behavioural data, interrupted journeys, weak conversions or user feedback.
Visitors quickly leave important landing pages.
Forms are viewed, but rarely completed and submitted.
The website seems acceptable on desktop, but the mobile experience is slow or unstable.
Pages contain heavy images, numerous scripts or animations that add little value.
Users report slowness, delayed clicks or incomplete loading.
Campaigns generate traffic, but landing pages do not convert enough.
Solutions
What performance optimisation should deliver.
Serious optimisation is not limited to a higher score. It must improve perceived speed, stability, responsiveness and the real fluidity of the user journey.
The expected result is both business and technical: less friction, more trust, more engagement and a stronger ability to convert existing traffic.
Technical diagnosis
An analysis of the real causes of slowness: resources, server, JavaScript, images, cache and rendering.
Faster pages
Priority improvement of the pages that matter most for traffic, SEO and conversion.
Smoother mobile experience
Faster, more stable and more comfortable navigation on the devices most commonly used.
Long-term monitoring
Regular tracking to prevent regressions after website updates.
What works
The principles of a fast, smooth and profitable website.
The best-performing websites are not necessarily the simplest visually, but they are designed with real technical control: useful resources, prioritised rendering, restrained components, efficient servers and a carefully built mobile experience.
Sustainable performance depends on a culture of restraint. Every image, script, animation, font or feature must justify its weight within the experience.
Restraint, priority, stability, measurement.
Limit unnecessary resources and reduce anything that does not add value to the journey.
Display essential content first, then progressively load secondary elements.
Avoid unexpected movements and slow interactions that disrupt the user.
Regularly monitor real performance and control technical regressions.
Conclusion
A slow website does not only hurt technical performance: it hurts growth.
A slow website directly affects user experience, conversion, credibility, SEO and the profitability of marketing actions. It can make visitors leave before they have even understood your offer.
Speed should therefore be integrated into the digital strategy from the design phase, then monitored over time. Every update, every added script, every published image and every feature can influence overall fluidity.
Investing in web performance means investing in a smoother experience, a more credible brand image and a more profitable journey. A fast website does not guarantee growth on its own, but it creates the conditions needed to better convert the traffic you already have.
Website speed is not a secondary comfort feature. It is a key factor in trust, conversion and business performance.
A slow website does not make users wait. It makes them doubt.
Speed is not just a technical metric. It is the first signal of professionalism sent to users. Before they read your content, they feel whether your site is fluid, controlled and reliable — or heavy, fragile and uncertain.
At Edikka, we see web performance as a silent form of persuasion. A fast website builds trust, makes action easier and supports every business lever: SEO, user experience, conversion and brand image.
Reassure quickly
Speed creates an immediate impression of control. A fluid website feels more professional, reliable and credible from the first seconds of navigation.
Keep momentum
Every slowdown breaks intent. Performance preserves user momentum, reduces abandonment and makes each interaction feel more natural.
Convert better
A fast website does not only improve experience. It improves visibility, supports SEO, strengthens trust and turns traffic into concrete results more effectively.
Go further on this topic
Additional answers to clarify the key points covered in this article.